Reading the Money Flow: Winning the Bremen Big Data Challenge 2025 Without a Black Box

A network insight that proved more reliable than any trained model — and what it means to look at data rather than just feed it.
The professional track of the Bremen Big Data Challenge 2025 posed an anti-money-laundering problem: transaction-level data for roughly 11,000 accounts, about 15% of them involved in money laundering and the task was to identify the fraudulent accounts. The obvious approach, and the one chosen by many strong teams, is to train a model on it. Our team SpiderBobs (Eda Cakir, Ali Salehzadeh-Yazdi, and myself, from Marc-Thorsten Hütt’s Computational Systems Biology group) instead analyzed the structure of the money flow — and took first place.
This post isn’t about the competition; it’s about our science-driven rather than ML-driven approach, which secured us first place.
The standard path
As a first step, we tested the usual models, including LSTM networks on the transaction sequences. They all worked, but they leave you with a classification you have to accept without understanding which features of the dataset it exploits. However, this structure was exactly what we wanted to find before training anything.
Looking at the network
In the given dataset, every account is a node of the network and every transfer a directed edge. Looking at the network directly is predictably useless: even if you plot only the top 1,000 accounts: the structure is too complicated to be able to visually analyze it. One needs to use the right measure.
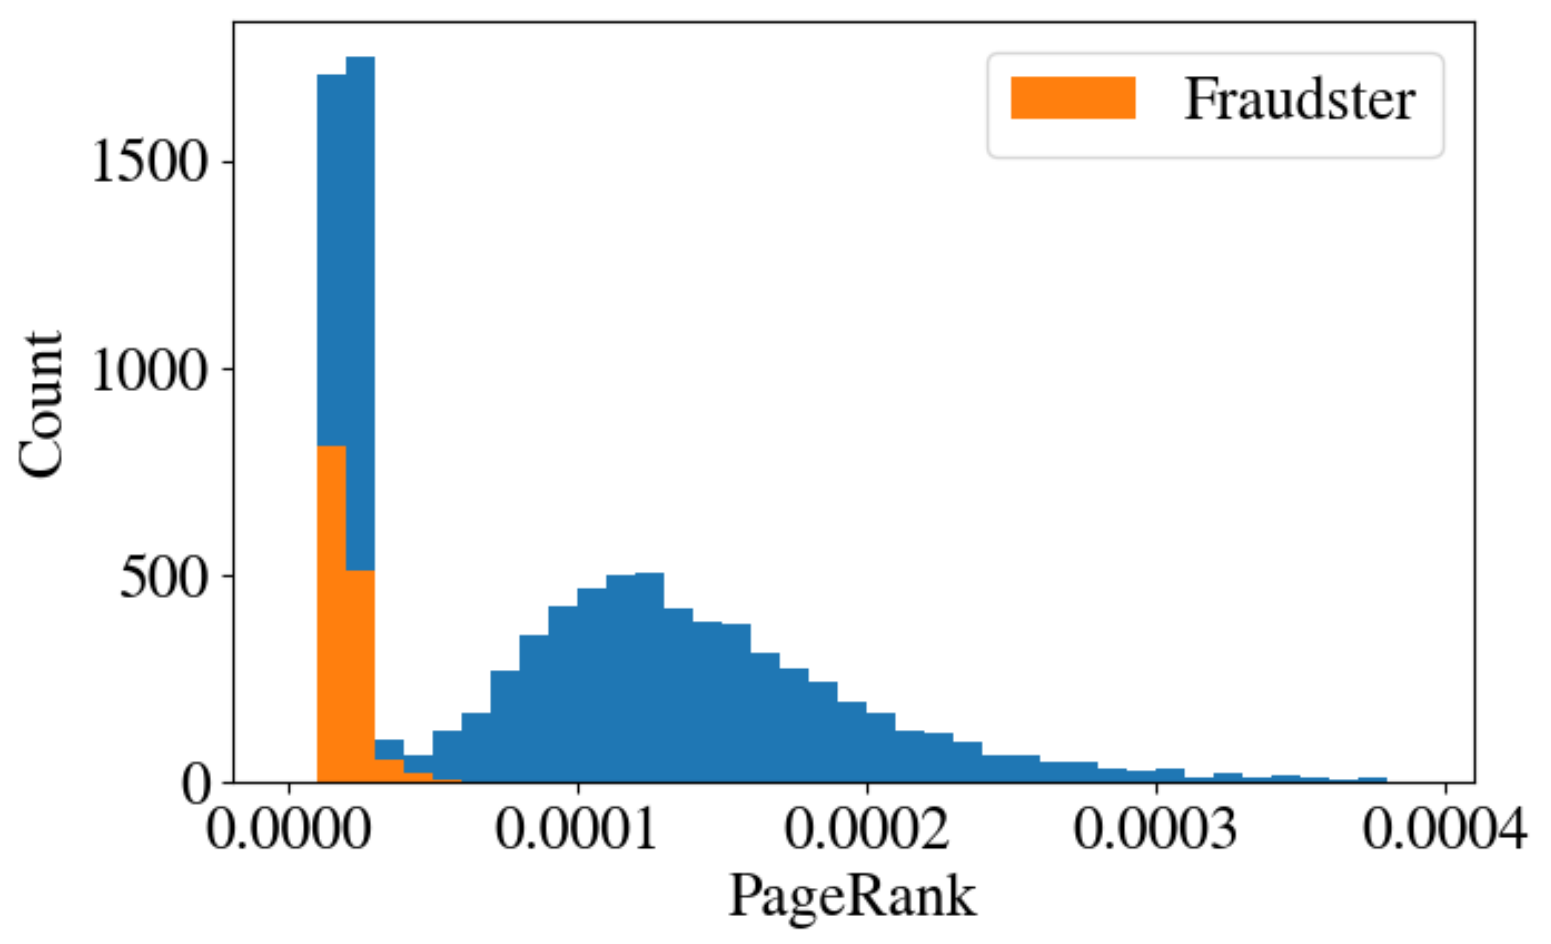
In order to understand the signatures hidden in the structure, we used the PageRank centrality. The distribution was helpful, though not in the way we first hoped: fraudulent accounts cluster, without exception, at very low PageRank values, but so do many legitimate accounts. Low centrality is therefore not a fraud signal and can hence not be used to detect fraud. However: there was a clearly separated group of non-fraudster accounts with anomalously high PageRank. This group caught our attention.
The Receiver Community
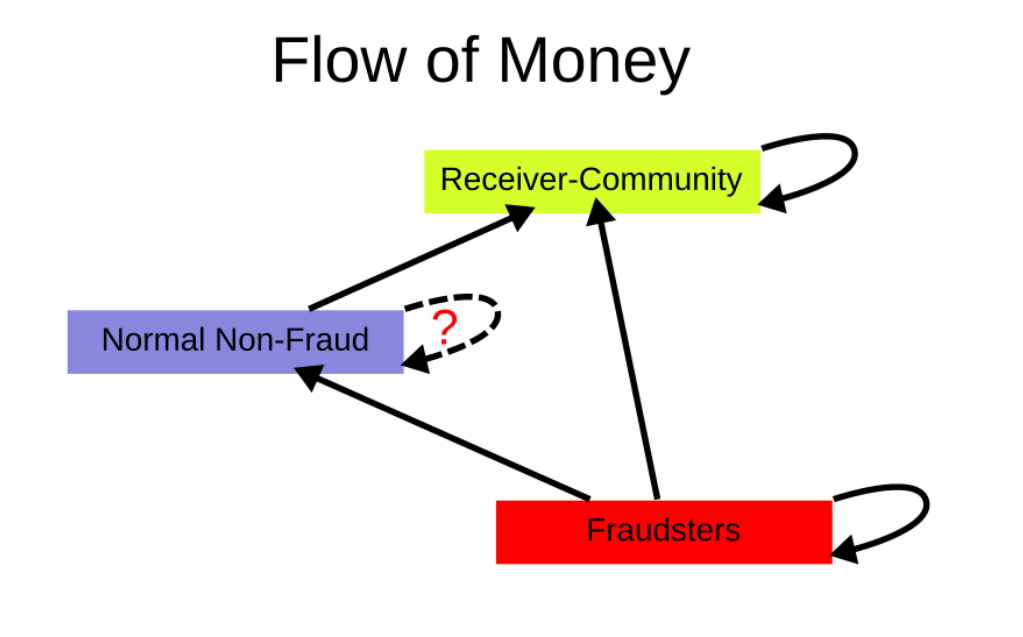
If you follow the money flow within the network (the money transfers), it always ends up in a closed group of accounts that receive money and only pass it among themselves. We called this group the Receiver Community. It is the convergence point of the flow and it contains no fraudsters, and it turned out that it is this Receiver Community that forms the separated group in the PageRank distribution.
This opened up an unconventional analytical approach for us: The Receiver Community can be identified from network topology alone, and it provides a gold standard for “legitimate behavior”. We now had a reference for “normal”.
A second structural criterion we found: legitimate accounts that do not belong to the community transfer into the community. Accounts that instead transfer money to recipients outside the community do not behave like legitimate ones.
Showing the signal is real: a statistical cross-check
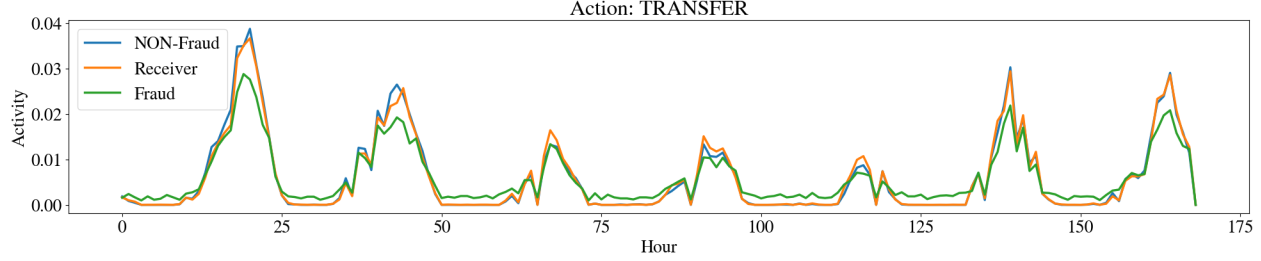
As already mentioned, we used the Receiver Community as a trustworthy reference for “normal”. From the Receiver Community one can hence estimate a typical activity profile of legitimate accounts: the temporal intensity of actions such as CASH_OUT and TRANSFER over the course of the week. Also the legitimate non-community accounts followed this profile closely, whereas fraudulent accounts deviate visibly, especially for TRANSFER (see Fig. 3).
We used this observation for a statistical analysis: With the expected value (an account’s activity weight times the expected hourly activity from the reference), we modeled the observed action counts as Poisson-distributed,
and flagged accounts that were active (performed e.g. money transfers) at times where legitimate accounts essentially never do.
The result
Using the analyses outlined above, our solution reached an score of on the test set,
beating all of our LSTM baselines while keeping every decision fully traceable.
It is certainly worth noting here that the data was artificially generated by the organizers and therefore exhibits unintended (and likely unrealistic) patterns (which, as mentioned above, can be statistically modeled). The “receiver community” property is a characteristic of this artificial dataset—it is certainly not a universal indicator of fraud. What can, however, be applied to the analysis of real data is our approach and mindset: Understand the data, understand the relationships, and try to analyze them, rather than blindly trusting a trained ML black box.
Why this matters to me
A trained ML system might have implicitly captured the community structure, but it would never have named it. Consequently, this structure would have remained misunderstood. Through our approach, we obtained a solution that was accurate and fully explainable. This is exactly what we as scientists should look for when tackling a problem: not the best fit, but the structure that generates the phenomenon.
Constructor University reported on the win. Questions about the method are welcome — feel free to get in touch.